30
September 2016
PDF version [628KB]
Carol Ey
Social Policy Section
Introduction
Statistics are widely used in the development and evaluation
of social policy. Closing the Gap indicators, studies on the effectiveness of
drugs being considered for inclusion in the Pharmaceutical Benefits Scheme
(PBS), analyses of National Assessment Program—Literacy and Numeracy (NAPLAN)
results and the evaluation of welfare interventions such as income management all
include statistics that guide decisions about where government resources are
directed.
However, not all statistics have the same level of
robustness, and their interpretation can be questionable. This paper attempts
to provide some guidance for non-statisticians about the questions they might
ask when presented with statistical information in order to assess how much
reliance they can put on it. This is not intended to be a comprehensive
coverage of the factors to be considered (more detailed references are provided
in links and in the further reading), but rather to provide a checklist of some
of the more common issues.
Given the nature of most of the data used in social policy,
the paper focusses on data about, or collected from, people.
What is being measured?
It is essential to check the definitions used in social policy
statistics. For example, different researchers may use different definitions of
terms such as homelessness
or poverty,
potentially leading to very different results. Even generally agreed
definitions such as unemployment
may be measured differently in some contexts. The definition of such terms can
also vary over time or between jurisdictions, so it is important to be cautious
about comparing statistics from different sources.
How was the data collected?
Types of data
Social policy development relies on data from two different
types of collection:
- censuses where data is collected from all those in a
particular population. For example, the five-yearly Census
of Population and Housing (the Census)
conducted by the Australian Bureau of Statistics (ABS) attempts to collect a
range of information on everyone in Australia (except foreign diplomats and
their families) on a particular night and
- samples which collect data on selected members of a population.
The type of information collected can include:
- questionnaires, where respondents are asked questions about
the topic
- tests, which can assess abilities or measure attributes
- observation, where the researcher collects information from
observing respondents and
- administrative
data, which is collected as a by-product
of running a program or providing a service, for example, Centrelink data,
hospital admissions data, crime statistics or school enrolment information.
Information can also be collected through unstructured interviews or
focus groups.
Information obtained through these techniques is not generally suitable for
quantitative estimates, but can be useful in providing greater understanding of
an issue, such as causal linkages.
Longitudinal data is where information is collected from the
same people multiple times over a period of time. This data can be collected by
any of the means described above. Major longitudinal studies include the Household, Income and Labour
Dynamics in Australia (HILDA) survey and the Australian
Census Longitudinal Dataset (ACLD).
Who collected it?
Major data collection agencies (for example the ABS) have
extensive processes in place to ensure the data they collect is of as high a
quality as possible. This includes pilot-testing survey questions, having
subject matter experts oversee the questionnaire design, and having extensive
training programs for interviewers. They may also have data
quality statements to provide users with information on possible issues
with the data.
University and publicly funded research is typically subject
to review from experienced researchers. Publishing copies of questionnaires and
details of sampling methodology, or making the data itself available for others
to analyse allows for independent assessment of the data quality.
Be cautious about using data when you cannot be sure it was
collected in a rigorous way.
Who did they ask?
For samples, a critical aspect of the wider applicability of
their results is how representative those selected are of the population as a
whole.
Random
samples are designed to ensure that anyone in the population has an equal
likelihood of being selected. Many surveys modify this random selection to
ensure they collect information from a range of people from different
gender/age groups and locations (for example state, city/country), and then
weight their results based on the proportion each group represents of the total
population (stratified
samples).
Other forms of sampling include quota
and convenience samples, which are non-probability samples. In quota
sampling, interviewers select respondents until a pre-determined number of
respondents in particular categories are surveyed. This technique is often used
by political pollsters and can produce reasonably reliable estimates if done
properly.
Convenience sampling includes online ‘opt-in’ polls. This
means that those who have a particular interest in the subject matter are more
likely to respond, which may not represent the views of the community as a
whole. Where the survey was advertised, for example, via a particular website
or Facebook page, will influence who responds.
The way the information is collected may also influence who
is asked. Online surveys exclude those without access to the internet, phone
surveys that don’t include mobile numbers are likely to underrepresent younger
people, while most surveys using face-to-face interviews exclude from possible
selection anyone living in a remote community because of the cost of collecting
the data.
People in institutions such as gaols, mental health facilities
and nursing homes and the homeless are usually not included in general sample
surveys, but may be included in specific surveys such as the Survey
of Disability, Ageing and Carers which specifically collects
information on people in cared accommodation.
Who answered?
The ABS technically has the power to compel
those selected in some of its surveys to respond (although penalties are
generally not enforced), but even in the Census it is acknowledged that some
people are not
included.
For most other researchers, even when they have provided incentives
such as payments for participants, non-response is a major concern. The key
issue is whether there is any difference between those who did and didn’t
respond. For example, are non-respondents likely to have lower levels of
education than respondents, are particular minority groups underrepresented,
and if so, are those from such groups who did respond representative of the
group as a whole?
What questions were asked?
The precise wording and order of questions is important.
This is particularly true in regard to sensitive or contentious issues.
Respondents are also more inclined to agree with a question
than disagree.
Scales are often used to assess the depth of feeling on an
issue, for example, rating on a scale of one to five how strongly you agree
with a proposition. However there is no standard on what number of points are
offered, whether the points are all labelled, or whether a neutral option is
offered, and these factors may
influence responses.
How reliable are the answers?
In some cases, data may be verified by checking with documented
evidence. For example, date of birth can be checked against a birth
certificate, or expenditure validated with receipts. In face-to-face
interviews, tests can be administered or measurements taken. Much
administrative data is verified, which is one of its strengths.
Diaries are more reliable than asking respondents to recall
events, and there is increasing use of technology to collect data, such as
wearable devices that record activity levels and sleep patterns.
Where data is not, or cannot be, verified, there are some
particular issues to be aware of. For example, people often self-report
themselves as taller and weighing less than actual measurements show, while
social
desirability bias means that aspects such as racist opinions, drug use or unusual
sexual practices are typically underreported.
It is also important to be aware of who actually answered
the questions. For example, the Census form is usually completed by one member
of the household who answers on behalf of the other members. This means answers
on questions such as religious beliefs may be filtered by the respondent.
Data collected through observation can be distorted
if the observers are looking for a specific effect.
Caution must also be used when looking at data on minority
groups such as Indigenous
Australians. Minority group identification is usually self-reported, and
hence prevalence may depend on factors such as how comfortable the person feels
about identifying or whether they consider it relevant to the particular
circumstances. This is a particular issue in relation to reporting minority
group status in administrative data.
The way the data is collected can also influence how people
respond, particularly to sensitive questions. There is evidence
to suggest that respondents answer questions about sensitive issues more
honestly when completing online surveys than when replying directly to a
person.
In sample data, the size of the sample makes a difference in
the reliability of the estimates produced. The National Statistical Service
(NSS) has a sample
size calculator that can be used to assess the accuracy of estimates if the
sample size is given. For example, to measure a response around the 50 per cent
mark in a random sample poll the accuracy of the result from a survey of 1,000
people will be plus or minus three per cent, while if 10,000 people are sampled
the accuracy is plus or minus one per cent.
How is the data described?
Descriptive
statistics summarise the responses and describe aspects such as the shape
(is the data distributed symmetrically around a central value?), mid-point and
spread of the data (what is the range of values, is it tightly grouped around
the middle values or evenly spread across most of them?). Examples of
descriptive statistics include the proportion of respondents who replied yes to
a question, or what the average income of respondents is. While these are not
statistically complex measures, they can be misrepresented.
The use of percentages can be misleading if the number
involved is small, so if only percentages are quoted it is important to know
how many people actually responded to that question. On the other hand, numbers
can sometimes be misleading if the underlying population is not taken into
consideration, so for much social policy data, the rate per head of population
is often more
relevant than the absolute number. Studies that quote the percentage
increase in percentages or rates can also be difficult
to interpret or misleading. If possible, using the underlying numbers will
put these in context.
What does ‘average’ mean?
While in common parlance ‘average’ may convey ‘typical’, in
statistics it is the mathematical mean (that is, the sum of all responses
divided by the number of responses). Much of the data in social policy is
distributed symmetrically (see (b) in Figure 1 below), and hence the mean is
the same as the mid-point of the population. However, some data, such as income,
is skewed with a long tail, that is, most responses are concentrated at the low
end of the distribution, but there are a small number of responses stretching
out to high values (see (c) in Figure 1). In such cases the average does not
reflect the ‘typical’ value, and a more relevant measure would usually be the
median, or 50th percentile, which is the point where half of the responses are
above it and half below. Similarly, the mode, or most frequent response will
also differ. The mode is generally only used in data where a limited number of
responses are possible, in which case the mode is the most common response.
Figure 1: Normal distribution and skewed distributions
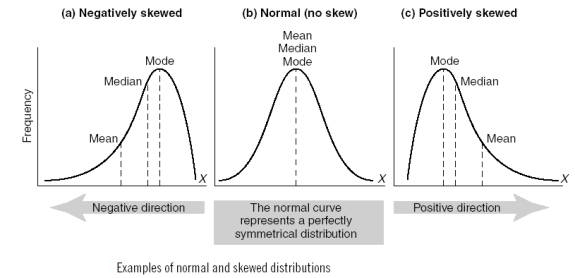
Source: IB Geography
Charts and graphs
Data is often displayed in chart or graphic form. This can
be a useful aid in showing some aspect of the data or making patterns clear.
However charts and graphs can also be used to distort
data. In considering any graphic information it is important to check the
axes and the scale, as well as being clear about exactly what data is being
presented.
Time series
In many cases changes over time are more significant for
policy purposes than absolute values. For example, whether a particular
indicator is increasing or decreasing, or whether there has been any change
following the implementation of new policy. In order to emphasise effects,
researchers will sometimes selectively use timeframes in the presentation of
their data. If possible, it is useful to consider the following:
- does the outcome change if a slightly different time period
is used (for example, using a ten year span rather than five, or shifting the
time period by a year or two)?
- do the results change if the data is accumulated in
financial years rather than calendar years?
- is there seasonal variation
that needs to be considered (for many of its economic indicators the ABS
produces ’seasonally adjusted’
series to overcome this issue)?
- if the data includes money, is it reported on a consistent
dollar basis over time (for example, all rebased to 2016 dollars)? This is
sometimes referred to as being in ‘real’ dollar terms or using ‘current prices’.
Trend
series are smoothed versions of time series, where small irregularities are
removed to make the underlying trend easier to observe, and are recommended by
the ABS for their key economic indicators.
Indexes
Researchers will sometimes develop an index to reduce a
complex range of information to a single figure, generally for comparison
purposes. Examples include the Gini Index, which is
a measure of income inequality, and the Human
Development Index, which itself is the average of three other indexes.
While indexes are often valuable summary measures, they can obscure underlying
differences.
Social policy studies frequently use an index to indicate socio-economic
status (SES) in their analysis. Such measures are derived from information
about a person’s economic (income, wealth, occupational status) and social
(education, communication skills, contacts) background. However, there is no
standard measure of SES, and the data available to a researcher often dictates
which measure they will use.
Sometimes this level of detail is not available in the data,
in which case researchers will use a proxy measure such as location of
residence. The ABS has produced rankings
of socio-economic advantage and disadvantage for a range of geographic areas
such as postal areas and Local Government Areas (LGAs). However these measures may
be a poor indicator of individual SES, particularly (but not only) in rural
locations such as mining towns which might include both people with high
incomes in professional occupations and a long term resident population with low
levels of education and high unemployment, or working in labouring jobs. It is
therefore important to consider the context in which the SES measure is being
used to assess whether applying a geographic average to individuals is
appropriate.
Interpretation of results
Correlation and causation
Much statistical analysis looks at the relationship between
variables to attempt to identify patterns. The extent to which two aspects
appear to be linked is described as their correlation. Statistical methods are
good at identifying whether two factors are correlated, however correlation
alone cannot show whether one of them causes the other.
The role of chance
Results being ‘statistically
significant’ mean they are unlikely to have happened by chance. Most
analysis uses a significance level of five per cent, that is, the chance of the
result occurring if there is no relationship is less than one in 20, although
one and ten per cent levels are also sometimes used. But it is important to
note that such a finding could have happened by chance. In particular,
where a complex study is undertaken and many different factors are analysed to
determine which ones may be related, it is likely that at least some of the
relationships will prove to be ‘statistically significant’ just through chance.
A 95 per cent ‘confidence interval’ (sometimes called the
‘margin of error’) means that there is a 95 per cent chance that the ‘real’
result is within the range quoted. Again, 99 and 90 per cent confidence
intervals are sometimes used. Projections
often use a ‘confidence interval’ to reflect the uncertainty of projecting past
trends into the future, or the effect of assumptions made. Knowing the
confidence interval is very important in assessing the validity of the result
or projection, in particular if comparing results from two different time
periods or studies. Different outcomes may not actually be different if their
confidence intervals overlap, that is, both results are within an overlapping
range.
Clustering of rare events, such as particular medical
conditions, is also an area where chance plays a significant role.
Counterintuitively, clustering
of rare events is actually more likely than an even spread. This means that
reports of a small cluster of rare cancers in a particular town, for example,
may well be the outcome of chance rather than a particular feature of the
location.
Comparing like with like
For some, the ‘gold standard’ method for social policy
research is the use of Randomised
Control Trials (RCTs). In these trials, people are randomly allocated to
two groups which are designed to be as equivalent as possible. Then a program
is administered to one group only and the outcomes compared between this group
and the ‘control’ group to determine the effectiveness of the intervention.
RCTs are commonly used in drug trails, where placebos are usually supplied to
the control group to overcome the influence that receiving any treatment often
has. Ideally such trials require that those conducting the trial do not know
which group will receive which treatment, and those administering the drug do
not know whether they are giving the test drug or a placebo. Even in medical
research this purity is hard to achieve,
while in most other areas of social research it is impossible. However, RCTs
are still more
powerful than most other methods in assessing what works.
Natural
experiments are where aspects such as differing laws, policy or practices
occur across different states or regions, making it possible to observe the
impact of the differences on similar populations. These have similar advantages
to RCTs in that they are comparing like with like, but as researchers are
observing the effect of differences rather than administering different
treatments, they are less subject to researcher influence or placebo effects.
However they are obviously limited in what aspects can be considered because
they can only be used where different practices happen to be implemented in
similar populations.
Comparing administrative data across jurisdictions should be
treated with caution, as differing definitions and environments may apply. For
instance, crime statistics may reflect differences in legislation, public
awareness, reporting, enforcement and sentencing arrangements even for the same
criminal act. International comparisons in many areas of social policy can be
extremely difficult, as different definitions, social conditions, administration
and data collection methods will all impact on the data.
Validation
It is often not possible to consider all the elements
described above to determine the validity of the results of a particular study.
Therefore some judgement will need to be made based on external factors such
as:
- what expertise does the person conducting the study have? For assistance
in evaluating expertise, see the Parliamentary Library publication Expertise
and public policy: a conceptual guide
- where is it published? Publication in a refereed journal or
at an academic conference does not guarantee quality but does at least mean the
study is subject to scrutiny by other qualified researchers
- what do other studies or data show? If the study is high
profile, academics or sites such as The Conversation may have identified related studies or data which may
confirm or contradict the findings. Parliamentary Library staff can also assist
clients by identifying related information.
Possible
biases
Most research funding relies on the researcher attempting to
find something new. This means that researchers will often keep working with
their data to find a result they can report on, to justify their funding. Also,
journals are more likely to publish interesting or controversial findings. As
noted above, if enough tests are conducted it is likely that something will
appear to be statistically significant, just on the basis of chance. For
various reasons, including lack of funding to reproduce someone else’s results,
much research is never fully validated.
Where research is conducted or funded by an interested group
there is a possibility that conflict of interest produces biased findings,
however this should be identifiable through considering aspects previously
identified, such as who was surveyed and what questions were asked.
Personal views can also influence how valid research is
perceived to be. People are more likely to accept a research finding that
confirms their existing opinion than one that disputes it, without necessarily
considering the validity of either study.
Also, statistics is the study of populations rather than
individuals. People often have difficulty accepting the results of a study if
it contradicts their personal experience.
Conclusion
Unless it is deliberately falsified, all data has some
validity. Conversely, in social policy research no data will ever be perfect due
to the constraints in dealing with people—it is not possible to collect all aspects
that might be relevant in a particular circumstance, and as noted above, the
accuracy of the data collected can be difficult to determine. However,
considering factors such as sampling methodology, questionnaire design and the
expertise of the researcher provides some guidance to the reliability of
findings and their application.
Social policy decision makers will often be confronted with
a situation where high quality data and analysis is not available, but
decisions have to be made on the basis of what information there is. Awareness
of the potential limitations of this information provides them with a better
basis for such decisions.
Further reading
The National Statistical Service (NSS) Learning
Hub has a wide range of information available to assist non-statisticians
in understanding statistical concepts and terminology, including:
Several publications provide non-technical
discussions of some of the issues of the use of statistics in public discourse
including:
Parliamentary Library publications on statistics in specific
social policy areas include:
For copyright reasons some linked items are only available to members of Parliament.
© Commonwealth of Australia

Creative Commons
With the exception of the Commonwealth Coat of Arms, and to the extent that copyright subsists in a third party, this publication, its logo and front page design are licensed under a Creative Commons Attribution-NonCommercial-NoDerivs 3.0 Australia licence.
In essence, you are free to copy and communicate this work in its current form for all non-commercial purposes, as long as you attribute the work to the author and abide by the other licence terms. The work cannot be adapted or modified in any way. Content from this publication should be attributed in the following way: Author(s), Title of publication, Series Name and No, Publisher, Date.
To the extent that copyright subsists in third party quotes it remains with the original owner and permission may be required to reuse the material.
Inquiries regarding the licence and any use of the publication are welcome to webmanager@aph.gov.au.
This work has been prepared to support the work of the Australian Parliament using information available at the time of production. The views expressed do not reflect an official position of the Parliamentary Library, nor do they constitute professional legal opinion.
Any concerns or complaints should be directed to the Parliamentary Librarian. Parliamentary Library staff are available to discuss the contents of publications with Senators and Members and their staff. To access this service, clients may contact the author or the Library‘s Central Enquiry Point for referral.